
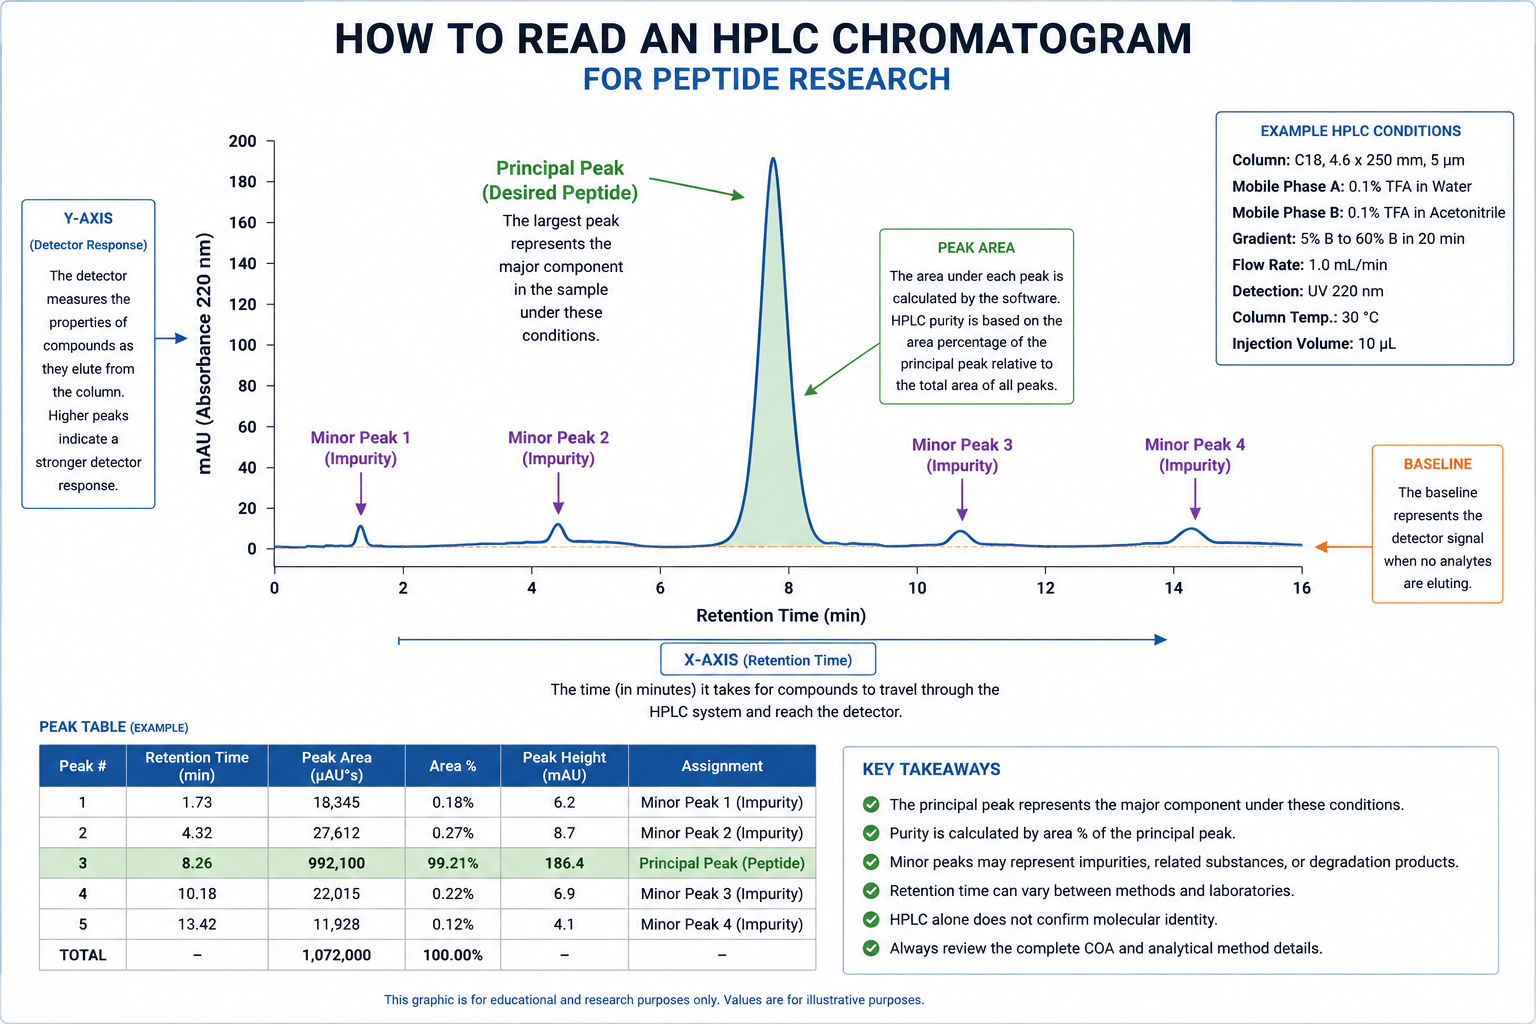
Learn how to read an HPLC chromatogram for peptide research, including retention time, principal and minor peaks, peak area, area percentage, baseline, and how chromatographic purity is interpreted in laboratory testing.
How to Read an HPLC Chromatogram for Peptide Research
An HPLC chromatogram can contain significantly more analytical information than the purity percentage printed on a Certificate of Analysis (COA).
For researchers reviewing peptide analytical documentation, understanding the basic components of a chromatogram can help answer questions such as:
What does the principal HPLC peak represent?
What are minor peaks?
What does retention time mean?
How is peak area calculated?
How is an HPLC purity percentage determined?
Can a chromatogram establish peptide identity?
Why can chromatograms differ between laboratories?
This guide explains how to read an HPLC chromatogram and how to interpret the information it provides within the limits of the analytical method.
Research-use notice: This article discusses analytical chemistry and laboratory characterization of research materials only. It does not provide information concerning administration, dosing, reconstitution for administration, clinical use, diagnosis, prevention, treatment, or human or animal use.
What Is an HPLC Chromatogram?
HPLC stands for high-performance liquid chromatography.
HPLC is an analytical technique used to separate components within a sample.
During an HPLC analysis, the sample is introduced into a flowing liquid mobile phase and passes through a chromatographic column containing a stationary phase.
Different components interact with the chromatographic system differently.
As components move through the column, they may separate and reach the detector at different times.
The detector records the resulting signals.
Those signals are displayed as a graph called a:
Chromatogram
A chromatogram allows researchers to visualize the detector response generated during the separation.
Understanding the X-Axis: Retention Time
The horizontal axis of an HPLC chromatogram typically represents:
Retention Time
Retention time describes how long it takes for a detected component to travel through the chromatographic system and reach the detector under the specified analytical conditions.
Retention time is often expressed in minutes.
For example:
Component
Retention Time
Peak 1
3.2 min
Peak 2
5.7 min
Principal Peak
8.4 min
Peak 4
10.1 min
The position of each peak along the X-axis therefore tells the researcher when that detector signal occurred during the chromatographic run.
Does Retention Time Identify a Peptide?
Retention time can provide useful analytical information, but retention time by itself should not automatically be treated as definitive molecular identification.
Why?
Because retention time depends on the chromatographic method.
Factors affecting retention can include:
Column chemistry
Column dimensions
Mobile-phase composition
Solvent gradient
Flow rate
Temperature
Sample preparation
Instrument configuration
A component that appears at one retention time using one method may appear at a different retention time using another method.
Therefore, researchers should avoid comparing retention times from unrelated analytical methods as though they were universal identifiers.
Understanding the Y-Axis: Detector Response
The vertical axis of a chromatogram represents the response generated by the detector.
Depending on the analytical method, the detector may measure characteristics such as ultraviolet absorbance.
When material passing through the detector produces a measurable signal, that signal appears as a peak.
Generally, a stronger detector response produces a larger signal.
However, detector response should not automatically be interpreted as the physical mass of a component.
Different compounds may generate different detector responses under the same conditions.
What Is an HPLC Peak?
A peak is a detector signal observed as material elutes from the chromatographic column.
A simplified chromatogram may look conceptually like this:
Baseline → Small Peak → Small Peak → LARGE PRINCIPAL PEAK → Small Peak → Baseline
In peptide analysis, researchers often focus on:
Principal peak
and
Minor peaks
The principal peak is typically the dominant integrated chromatographic signal.
Minor peaks represent additional detected chromatographic signals under the method conditions.
What Is the Principal HPLC Peak?
The principal peak is generally the dominant chromatographic peak associated with the component being evaluated.
If an HPLC report states:
Purity: 99.2%
the principal peak may account for approximately 99.2% of the relevant total integrated chromatographic peak area under the laboratory’s calculation method.
However, an important analytical distinction must be made:
The largest peak does not automatically prove molecular identity.
A chromatogram primarily provides information about chromatographic separation and detector response.
Additional analytical evidence may be used to support molecular identity.
What Are Minor HPLC Peaks?
Smaller peaks appearing around the principal peak are often referred to as minor peaks.
These represent additional detector responses.
Depending on the material and analytical method, minor peaks could potentially correspond to:
Peptide-related variants
Synthesis-related components
Truncated sequences
Deletion sequences
Oxidation-related products
Degradation-related components
Other detectable substances
However, researchers should not assign an identity to a minor peak based solely on its appearance or retention time.
Additional analytical characterization may be necessary to determine what a particular peak represents.
What Is Peak Area?
Laboratory software can calculate the area under a chromatographic peak.
This is known as:
Peak Area
Peak area represents the integrated detector response associated with that chromatographic signal.
For example:
Peak
Area %
Minor Peak 1
0.18%
Minor Peak 2
0.27%
Principal Peak
99.21%
Minor Peak 3
0.22%
Minor Peak 4
0.12%
Total:
100.00%
Under a relative area-normalization calculation, the principal peak would represent:
99.21% chromatographic area purity
How Is HPLC Purity Calculated?
A simplified area-normalization calculation can be represented as:
Principal Peak Area ÷ Total Integrated Peak Area × 100
For example:
Principal peak area = 992,100
Total integrated peak area = 1,000,000
The relative chromatographic area would be:
99.21%
This is the basis for some reported HPLC area-purity percentages.
However, the exact laboratory method and calculation procedure should always take precedence over a simplified example.
What Does 99% HPLC Purity Actually Mean?
If a COA reports:
HPLC Purity: 99.2%
it generally indicates that the principal integrated peak represented approximately 99.2% of the relevant integrated chromatographic peak area under the analytical conditions and calculation method used.
It does not automatically mean:
99.2% of the entire physical material by weight is peptide
The principal peak’s molecular identity has been independently established
Every possible impurity has been detected
Water content is 0.8%
Counterion content is 0.8%
Residual solvents total 0.8%
Endotoxin has been evaluated
Sterility has been evaluated
Those are separate analytical questions.
For a detailed explanation, see:
[Peptide Purity vs. Peptide Content: What’s the Difference?]
What Is the HPLC Baseline?
The relatively flat portion of a chromatogram between peaks is known as the baseline.
Ideally, the baseline allows chromatographic peaks to be distinguished clearly from background detector signal.
Real chromatograms are not always perfectly flat.
Researchers may encounter:
Baseline noise
Baseline drift
Solvent-related effects
Gradient-related changes
Instrument-related signal variation
A small fluctuation in the baseline should not automatically be interpreted as a genuine chromatographic impurity peak.
Peak detection and integration depend on the analytical method and data-processing parameters.
What Is Peak Integration?
Peak integration is the process used by chromatography software to determine the area associated with chromatographic peaks.
The software determines where a peak begins and ends and calculates its integrated area.
Integration parameters matter.
Different integration decisions can affect:
Which signals are counted as peaks
Where peak boundaries are placed
Total integrated area
Relative area percentages
This is one reason researchers should evaluate the complete analytical report rather than focusing exclusively on a single purity percentage.
What Is Peak Height?
Peak height measures the vertical distance between the chromatographic baseline and the top of a peak.
Peak height and peak area are related but are not the same measurement.
A narrow peak and a broad peak could potentially have different heights while producing comparable integrated areas.
For relative chromatographic purity calculations, laboratories frequently report peak area or area percentage rather than relying solely on peak height.
What Is Peak Resolution?
One of the goals of chromatography is to separate components sufficiently for them to be evaluated.
When two peaks are clearly separated, they are easier to integrate independently.
If two components elute very close together, their signals may overlap.
This can result in:
Co-elution
If two substances co-elute, they may not appear as two completely separated peaks.
Therefore:
One chromatographic peak does not necessarily prove that only one chemical component is present within that region.
Method selectivity and resolution matter.
What Is a Shoulder Peak?
Researchers may sometimes notice a smaller feature attached to the side of a larger peak.
This may be described as a:
Shoulder
A shoulder can indicate that more than one chromatographic component may be contributing to that region of the chromatogram.
However, visual appearance alone should not be used to determine chemical identity.
The method, resolution, integration, and potentially additional analytical testing must be considered.
What Is the Peak Table?
Many laboratory reports include a peak table alongside the chromatogram.
A peak table may report:
Peak number
Retention time
Peak area
Area percentage
Peak height
Other chromatographic parameters
For example:
Peak
Retention Time
Area %
1
3.14
0.12%
2
5.86
0.24%
3
8.47
99.31%
4
10.22
0.19%
5
12.06
0.14%
The peak table makes it easier to examine the numerical information behind the visual chromatogram.
How to Read an HPLC Chromatogram Step by Step
When reviewing an HPLC chromatogram on a peptide COA, researchers can follow this sequence.
Step 1: Verify the Sample Information
Look for:
Sample name
Sample ID
Lot number
Laboratory report number
Make sure the chromatogram belongs to the report being reviewed.
Step 2: Check the Analysis Date
Confirm when the chromatographic analysis was performed.
Step 3: Identify the X-Axis
Determine whether retention time is displayed and which units are used.
Step 4: Identify the Y-Axis
Determine what detector response is represented.
Step 5: Locate the Principal Peak
Find the dominant integrated chromatographic signal.
Step 6: Examine Minor Peaks
Look for additional integrated signals and their reported area percentages.
Step 7: Review the Peak Table
Compare retention times and integrated areas with the graphical chromatogram.
Step 8: Look at the Purity Result
Determine how the laboratory reports the principal peak’s relative area.
Step 9: Review the Analytical Method
Look for information about the HPLC method and detector.
Step 10: Look for Complementary Testing
Determine whether molecular identity or other analytical characteristics were evaluated separately.
Why the HPLC Method Matters
An HPLC chromatogram is the result of a specific analytical method.
Changing the method can change the chromatogram.
Important variables include:
Column
Different stationary phases can produce different chromatographic separation.
Mobile Phase
The composition of the liquid moving through the column affects interactions with the sample.
Gradient
Changes in mobile-phase composition during the run can affect when components elute.
Flow Rate
The speed at which the mobile phase travels through the column can affect retention behavior.
Temperature
Column temperature can influence chromatographic separation.
Detection Wavelength
Different compounds can produce different responses depending on the wavelength being monitored.
Because of these variables, two chromatograms should not automatically be considered directly comparable simply because they analyze similarly named materials.
Why Detection Wavelength Matters
Many peptide HPLC methods use ultraviolet detection.
The selected wavelength affects how strongly different components are detected.
This matters because HPLC area percentage is based on detector response.
Different components may not produce identical detector responses at a given wavelength.
Therefore:
Chromatographic area percentage should not automatically be interpreted as absolute mass percentage.
Can You Identify an Impurity From Its HPLC Peak?
Usually not from the chromatogram alone.
An HPLC peak tells researchers that a detector response occurred at a particular retention time.
Determining the chemical identity of that component may require additional analytical techniques.
For example, chromatographic separation may be coupled with mass spectrometry.
This combination is commonly referred to as:
LC-MS
The chromatographic system separates components while mass spectrometry provides additional molecular information.
HPLC vs. Mass Spectrometry
These techniques provide complementary analytical information.
HPLC
Mass Spectrometry
Separates sample components
Measures ions by mass-to-charge ratio
Produces chromatograms
Produces mass spectra
Provides retention times
Provides m/z values
Can evaluate relative chromatographic purity
Can provide molecular-mass information
Does not independently establish complete molecular identity
Does not automatically provide HPLC area purity
Researchers may therefore see both techniques included in peptide analytical documentation.
What an HPLC Chromatogram Cannot Tell You by Itself
An HPLC chromatogram should not automatically be used to determine:
Absolute peptide content
A relative peak-area percentage is not necessarily an absolute mass measurement.
Complete molecular identity
Additional identity evidence may be needed.
Water content
This requires an appropriate water-analysis method.
Counterion content
This requires separate analytical evaluation.
Residual solvents
Separate residual-solvent analysis is required.
Endotoxin
Endotoxin requires a specific endotoxin test.
Sterility
Sterility is not established by an HPLC chromatogram.
The key analytical principle is:
A test provides evidence about what that test was designed to measure.
Common HPLC Chromatogram Mistakes
Mistake #1: Looking Only at the Purity Percentage
A chromatogram and peak table provide more context than the headline number alone.
Mistake #2: Assuming the Largest Peak Automatically Proves Identity
Peak size alone does not establish molecular identity.
Mistake #3: Treating Area Percentage as Absolute Mass Percentage
These are different measurements.
Mistake #4: Comparing Retention Times Across Different Methods
Retention time depends on analytical conditions.
Mistake #5: Assuming Every Small Signal Is an Impurity
Baseline noise and other analytical effects can produce small signals.
Mistake #6: Assuming One Peak Means One Chemical Component
Co-elution can occur when components are not completely chromatographically resolved.
Mistake #7: Assuming HPLC Tests Everything
HPLC does not replace separate tests for unrelated analytical characteristics.
How to Evaluate an HPLC Chromatogram on a Peptide COA
Before relying on chromatographic data, ask:
Does the chromatogram identify the sample?
Does the sample ID correspond with the COA?
Is the lot number identifiable?
Is the laboratory identified?
Is the analysis date shown?
Is the HPLC method identifiable?
Is the detection wavelength reported?
Is the principal peak clearly visible?
Are minor peaks reported?
Is a peak table available?
Does the reported purity correspond with the peak data?
Is molecular identity evaluated separately when claimed?
These questions provide considerably more information than asking only:
“What is the purity percentage?”
Frequently Asked Questions About HPLC Chromatograms
What does the largest peak on an HPLC chromatogram mean?
The largest integrated peak generally represents the dominant chromatographic detector response under the analytical method. Its size alone does not establish molecular identity.
What do small peaks on an HPLC chromatogram mean?
Small peaks represent additional detected chromatographic signals. Their chemical identities cannot necessarily be determined from the chromatogram alone.
What does retention time mean?
Retention time is the time required for a detected component to pass through the chromatographic system and reach the detector under the specified method conditions.
What does HPLC area percentage mean?
Area percentage describes a peak’s integrated detector response relative to the relevant total integrated chromatographic area under the calculation method.
Does a 99% HPLC peak mean 99% peptide?
Not necessarily. Relative chromatographic purity and absolute peptide content are different analytical measurements.
Can an HPLC chromatogram prove peptide identity?
Not by itself. Additional analytical methods can provide molecular-identity information.
What is the baseline on an HPLC chromatogram?
The baseline represents the detector signal between chromatographic peaks and can include background signal or noise.
What is a chromatogram peak table?
A peak table provides numerical information about chromatographic peaks, often including retention time, area, area percentage, and other parameters.
Understanding HPLC Data at First Choice Peptides
At First Choice Peptides, we believe researchers should be able to evaluate available analytical documentation beyond a headline purity percentage.
Understanding how to read an HPLC chromatogram can help researchers examine the analytical information associated with a batch and better understand what a reported purity result represents.
Continue learning:
[What Is HPLC Peptide Purity? A Researcher’s Guide]
[Peptide Purity vs. Peptide Content: What’s the Difference?]
[How to Read a Peptide Certificate of Analysis (COA)]
[How to Verify a Peptide COA and Laboratory Test Report]
[Third-Party Peptide Testing: What Researchers Should Look For]
[What Is a Certificate of Analysis (COA) for Research Peptides?]
[Certificate of Analysis Library]
Final Takeaway
Learning how to read an HPLC chromatogram means looking beyond the largest peak.
Researchers should examine:
Retention time
Detector response
Principal and minor peaks
Peak area
Area percentage
Baseline
Peak integration
Method conditions
Sample identification
and complementary analytical testing.
Most importantly, researchers should understand the limitations of the measurement.
An HPLC chromatogram provides valuable information about chromatographic behavior and relative detector response under a specified method.
It should not be interpreted as providing analytical information that the HPLC method was not designed to measure.
Research use only